new R package to visualize remote sensing data and movement tracks: moveVis

new R package to visualize remote sensing data and movement tracks: moveVis

July 20, 2017

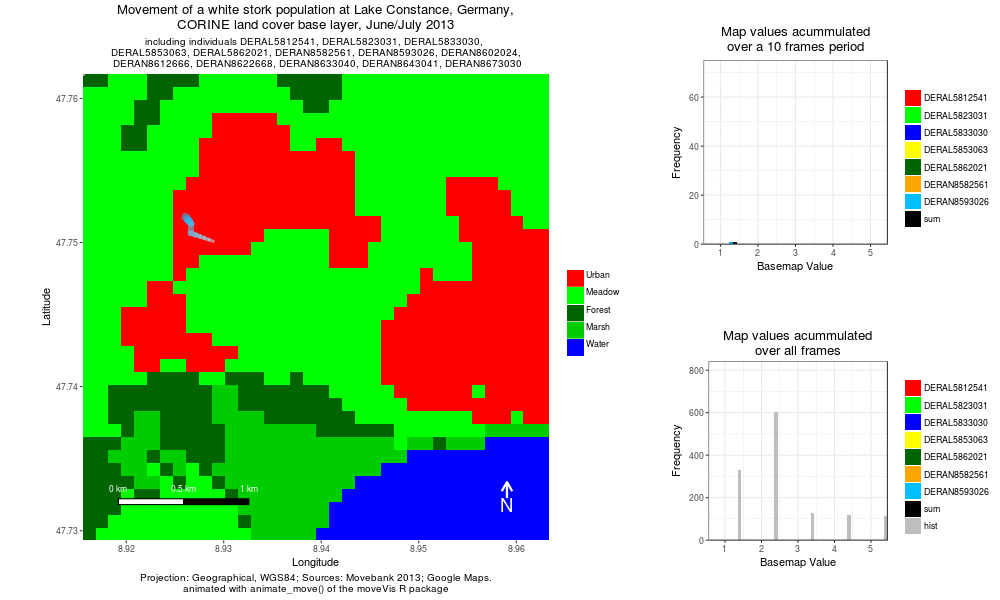
Our EAGLE M.Sc. student Jakob Schwalb-Willmann developed the moveVis package and is now available via CRAN. Beside the animation of movement also the corresponding environmental values can be shown for the whole extent, as cumulative values per individual or across the whole group or just the average value of the last n steps to highlight changes in species-environment relationships. All graphical parameters can be changed by the user via ggplot commands for the map and the statistics graphs. MoveVis will also be covered in the next AniMove course.

Please report any issues to the bug manager at www.movevis.org or post your questions to the AniMove mailing list.


Please also send us (via mail, twitter or FB) your best moveVis animations and we are happy to create a gallery of animations. Please also provide information how to reference the animation (your name, affiliation, email).


This initiative is part of the Opt4Environment project and was funded by the German Aerospace Center (DLR) on behalf of the Federal Ministry for Economic Affairs and Energy (BMWi) with the research grant 50 EE 1403. The movement data we used was provided by the Max Planck institute for Ornithology (MPIo). Click below to reach the involved parties.


follow us and share it on:

you may also like:

Starkregen in Bayern: Beobachtungen und Dokumentation zählen

Starkregen in Bayern: Beobachtungen und Dokumentation zählen

Starkregenereignisse treten immer häufiger lokal, kurzfristig und mit hoher Intensität auf. Innerhalb weniger Stunden können sie erhebliche Überschwemmungen und Schäden verursachen. Um solche Ereignisse künftig besser zu verstehen und die wissenschaftliche Grundlage...

Seeing the World in Points: Lidar Course for the EAGLEs

Seeing the World in Points: Lidar Course for the EAGLEs

Lidar has a funny way of sneaking up on you. You think you know what it is, a laser that measures distance, fine, but then someone shows you a point cloud of a forest canopy with individual branches floating in 3D space and suddenly you realize there's a whole...

RTL covers EORC: TV Crew Films MONID Habitrack Fieldwork

RTL covers EORC: TV Crew Films MONID Habitrack Fieldwork

A bit of extra excitement at EORC recently, an RTL television crew showed up to film a segment on the MONID Habitrack project, and Dr. Ariane Droin was right in the middle of it, walking them through what Earth Observation actually brings to the table for a project...

Ticks from Above: UAS Fieldwork for the MONID Habitrack Project

Ticks from Above: UAS Fieldwork for the MONID Habitrack Project

Forest edges are tricky places. They're where woodland meets open ground, where light and shade trade off every few meters, and where, it turns out, ticks tend to do really well. That last bit is exactly why Dr. Ariane Droin, Sofica Garcia de Leon, Dr. Jakob...

Course on urban EO by Michael Wurm

Course on urban EO by Michael Wurm

Walk through any city and you pick up on things that are hard to put a number on. The noise of a main road, the heat that sits between buildings in summer, the question of whether that little park around the corner is really enough green space for the whole...

EireR R package: unified gateway to Irish geospatial data

EireR R package: unified gateway to Irish geospatial data

Anyone who's tried to do geospatial work across the whole island of Ireland knows the headache. Ireland is one island geographically, but it's split across two jurisdictions, the Republic and Northern Ireland, and each one runs its own data infrastructure. Different...

Share This